Activity monitor has been refreshed in SQL Server 2008 Management studio. Microsoft has recoded the activity monitor written for SQL 2005 to provide more information on SQL Server processes and how these processes affect the current instance of SQL Server. The first change which I experienced is the real time graphical view of processes, CPU time etc, this really helps us to know the status of the server immediately.
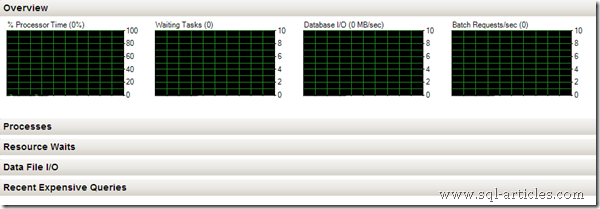
Activity Monitor is a tabbed document, which has 5 tabs to show the status of the server as shown below. All these tabs are collapsible, so when you expand a tab it will collect information regarding to that tab and provide the output, if the tab is collapsed then it will stop collecting information from the server. Overview, Active User Tasks, Resource Waits, Data File I/O, and Recent Expensive Queries are the 5 tabs of activity monitor.
How to open Activity monitor in SQL Server 2008 Management studio?
In the old version of management studio you can open activity monitor under Management folder, but now its changed in SSMS 2008. A user can open activity monitor in two ways either from object explorer or through tool bar. An additional option is also set to SSMS startup, you can enable activity monitor in SSMS startup so that when you open SSMS 2008 activity monitor will also gets opened.
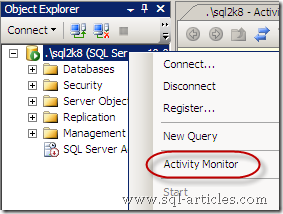
Open through Object Explorer
* Connect to SQL server
* Right click on the SQL server instance name ,
* Now click on the activity monitor to open it
Open through Toolbar
* Open Management studio 2008,
* In the standard toolbar you can find the icon shown below, clicking on that will open activity monitor.
* Once its opened you can connect to SQL server instance to get the status
![]()
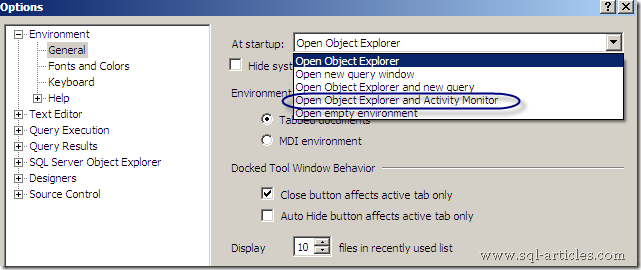
Setting startup option in SSMS
* Open SSMS 2008, Go to Tools> Options
* In the left hand pane expand Environment and click on General
* In the right hand pane click on At startup drop down menu , now select Open Object explorer and activity monitor as shown below
* Click Ok and restart SSMS
Five tabs of Activity Monitor
Activity monitor has 5 tabs to describe the server status, lets see one by one. All these tabs are collapsed by default except Overview tab.
Overview
Overview tab is the first tab and its expanded by default. This pane shows the graphical displays of instance information which has % Processor Time, Waiting Tasks, Database I/O and Batch Requests/sec as shown below

Active User Tasks
This pane shows information for active user connections to the instance. This tab also provide more information in columns, you can rearrange the columns and sort or filter the columns as per your need. You can also run profiler from here for a particular process, just right click on a process and click on Trace process in SQL Server profiler, profiler will start capturing the process.

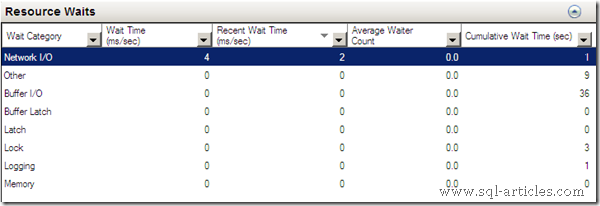
Resource Waits
This pane shows information about waits for resources for the instance.
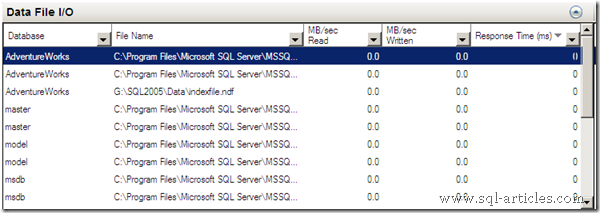
Data File I/O
This pane shows information about the database files for the databases that belong to the instance.
Recent Expensive Queries
This pane shows information about the most expensive queries that have been run on the instance over the last 30 seconds. The information is derived from the union of sys.dm_exec_requests and sys.dm_exec_query_stats, and includes queries in process and queries that finished during the time period.

Activity monitor works with old version of SQL Servers?
Yes, Activity monitor works well when you connect to old versions of SQL (SQL2K5 only). You will get the similar output in old versions too.
What are the permissions required to use Activity Monitor?
If you are connecting to SQL 2005 or SQL 2008 then the user should have VIEW SERVER STATE permission.
Leave a Reply