DMV’s are system views and its a new feature started SQL server 2005 with nearly 80 DMVs. DMV’s are system view that surface the internal counters of the database engine help present an easily comprehendible dashboard of the database engine performance that can be used to monitor the health of a server instance, diagnose problems, and tune performance. Unlike tools like Windows System Monitor(perfmon.exe) and SQL Server Profiler that need to be explicitly invoked and setup to collect the data events of interest. DMVs are always active and constantly collecting the performance data for the instance of SQL Server 2005. As the name suggests, DMVs are dynamic in nature, implying that the data they present represents the instantaneous state of the database engine. Because the state is constantly changing, successive queries to the same DMV usually produce different results.
All DMVs and functions exist in the SYS schema and follow this naming convention: dm_*. When you use a dynamic management view or function, you must prefix the name of the view or function with the name of the schema. DMVs can only be referenced using two-part(eg. sys.dm_exec_query_stats), three-part(eg. master.sys.dm_exec_query_stats) or four-part names(eg. Server1.master.sys.dm_exec_query_stats). They cannot be referenced using one-part names(eg. dm_exec_query_stats).
All the DMVs are installed by default along with the database engine, you don’t need to install this separately. All DMV counts are dynamic in nature and initialized to zero (0) when the instance of SQL server 2005 is started. There are two types of DMVs and functions, they are server-scoped and database-scoped. Querying a dynamic management view or function requires SELECT permission on object plus the VIEW SERVER STATE permission for server-scoped DMVs, or the VIEW DATABASE STATE permission for the database-scoped DMVs
Lets discuss on some of the important DMV’s
sys.dm_os_schedulers
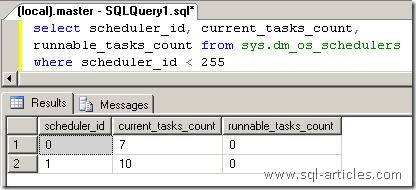
sys.dm_os_schedulers view to see if the number of runnable tasks is typically nonzero. A nonzero value indicates that tasks have to wait for their time slice to run; high values for this counter are a symptom of a CPU bottleneck. Scheduler_id greater than 255 is used for internal purposes and hence we are neglecting those values.
SELECT scheduler_id, current_tasks_count, runnable_tasks_count FROM sys.dm_os_schedulers
WHERE scheduler_id < 255

sys.dm_db_file_space_usage
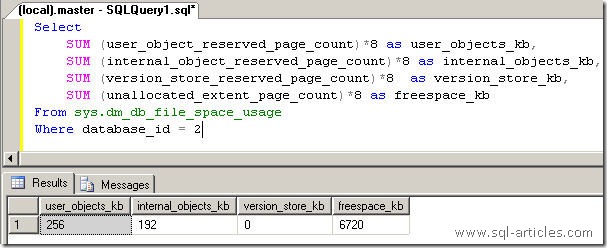
This counter tracks free space in tempdb in kilobytes. Administrators can use this counter to determine if tempdb is running low on free space. Currently this DMV can only be used with tempdb database and not with any other database. The below query returns the tempdb space used by user and by internal objects.
SELECT
SUM (user_object_reserved_page_count)*8 AS user_objects_kb,
SUM (internal_object_reserved_page_count)*8 AS internal_objects_kb,
SUM (version_store_reserved_page_count)*8 AS version_store_kb,
SUM (unallocated_extent_page_count)*8 AS freespace_kb
FROM sys.dm_db_file_space_usage
WHERE database_id = 2

sys.database_mirroring
This DMV is useful when you need to find information about database mirroring. This will provide the list of databases, principal, mirror and witness server details. You can also check whether mirroring status.
SELECT DB_NAME(database_id) AS 'Database Name',mirroring_state_desc,mirroring_role_desc
mirroring_safety_level_desc,mirroring_partner_name,mirroring_partner_instance,
mirroring_witness_name, mirroring_witness_state_desc,mirroring_connection_timeout
FROM sys.database_mirroring WHERE mirroring_guid <> NULL
sys.dm_exec_connections, sys.dm_exec_requests & sys.dm_exec_session
The above 3 DMV's are good to check out the sessions, connection and the requests placed by SPID's to the server. When you use these DMV's in combination you will get more information compared to SP_Who2 proc. I hope this will surely replace SP_who2 proc. In the query below I've used SPID to point above 51 to get user sessions alone!!
SELECT sys.dm_exec_requests.session_id, sys.dm_exec_requests.status,st.text AS [Command TEXT],
command,DB_NAME(database_id) AS DatabaseName,sys.dm_exec_sessions.cpu_time,
sys.dm_exec_sessions.memory_usage,sys.dm_exec_sessions.reads,sys.dm_exec_sessions.writes,
login_time, [HOST_NAME],client_net_address,program_name
FROM sys.dm_exec_requests
INNER JOIN sys.dm_exec_connections ON sys.dm_exec_requests.session_id = sys.dm_exec_connections.session_id
INNER JOIN sys.dm_exec_sessions ON sys.dm_exec_sessions.session_id = sys.dm_exec_requests.session_id
CROSS APPLY sys.dm_exec_sql_text(sql_handle) AS st
WHERE sys.dm_exec_requests.session_id >= 51
sys.dm_io_virtual_file_stats & sys.dm_io_pending_io_requests
SQL Server performance depends heavily on the I/O subsystem. Unless your database fits into physical memory, SQL Server constantly brings database pages in and out of the buffer pool. This generates substantial I/O traffic. Similarly, the log records need to be flushed to the disk before a transaction can be declared committed. You can use the following DMV query to find currently pending I/O requests. You can execute this query periodically to check the health of I/O subsystem and to isolate physical disk(s) that are involved in the I/O bottlenecks.
SELECT database_id, FILE_ID, io_stall, io_pending_ms_ticks, scheduler_address
FROM sys.dm_io_virtual_file_stats(NULL, NULL)t1, sys.dm_io_pending_io_requests AS t2
WHERE t1.file_handle = t2.io_handle
Conclusion:
DMV's are most helpful functions are views in SQL server 2005 to get the server performance, load etc. But all these data's are fetched from the time of sql server started..

Leave a Reply