Last month Ive wrote an article on Performance Data Collector part one, I thought of writing part 2 soon however I was stuck with Organizing SQL Code Camp with my fellow MVP Deepak & Sugesh. Now its almost a month so thought of writing the second part. In this part we are going to see how to customize the data collection, retrieval of reports from PDW (Performance Data Warehouse) etc.
Lets see the rest of the subtopics covered under performance data collector.
Security & Roles
In this section we are going to see what are the roles available related to performance data collector and its uses. We have 3 fixed roles in Configuring and Using the Management Data Warehouse & Configuring and Using the Data Collector categories of PDW. Im not going to write more detail about this security roles since its already well document in KB article. For more information check out the link http://msdn.microsoft.com/en-us/library/bb630341.aspx. These roles are stored in msdb database and by default no users will be added to the group.
Data Collection Method
Performance Data collector supports two methods of data collection, each method has its own pros and cons.
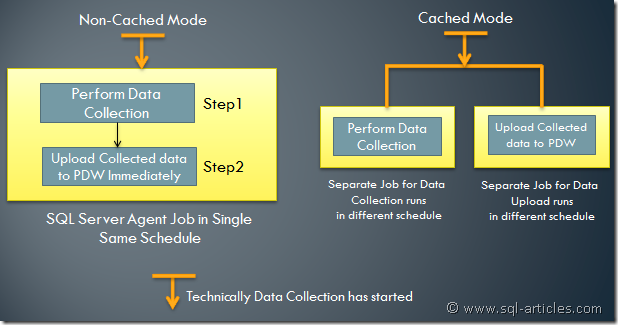
Cached Mode : In this mode we have two separate jobs for collecting and uploading the data. Each job will run on separate schedule, the first job will collect the data and store it in a temporary location (given at the time of configuration) and it wont care about upload job. Second job will start on its own schedule and check for data in temporary location, if it has new data it will start upload the data. Consider you have configured PDW for multiple instance at that time your data warehouse server will not stressed more since collect and upload are running in different schedules however the drawback is that you wont be able to view the collected data immediately.
Non-Cached Mode : In this mode we have only one job which performs both collect and upload (two separate steps) in same schedule. After the job starts it will run the collect SSIS package and then it will immediately upload the collected data to the data warehouse server. In this method you will get the data immediately however your data warehouse server is stressed if you configure to collect it in multiple server.
For simple understanding Ive created the image below
Viewing Data Collection Sets
If you want to view what each data collection set is doing, just go to its properties. You will be able to view the queries or counters used to get information from the server. To obtain this follow the steps below
-
Connect to SQL Server in SSMS
-
Expand Management folder and then expand Data Collection and then System Data collection sets
-
You can find Disk Usage, Query Statistics, Server Activities and Utility Information.
-
Just right click on the required set and then click on properties
-
In the window you can find the details as shown below (Ive taken it for server activity collection set) In the first image Ive chosen DMV details , so you can get the queries used. In the second image Ive chosen to get performance counter details, so in the below pane it shows the counters used.
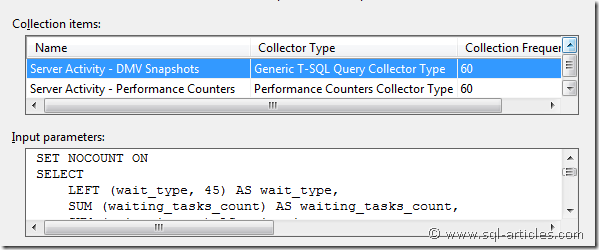
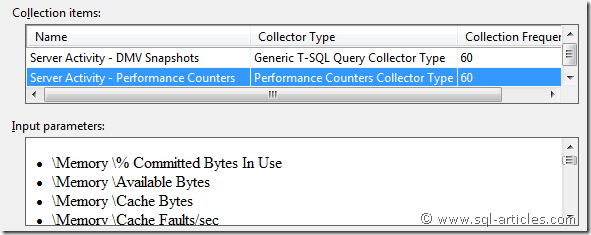
With these queries and counters SQL is able to pull the data from the server (collect process) and it will upload it to the data warehouse server based on the collection mode chosen.
Start or Stop Collection Set
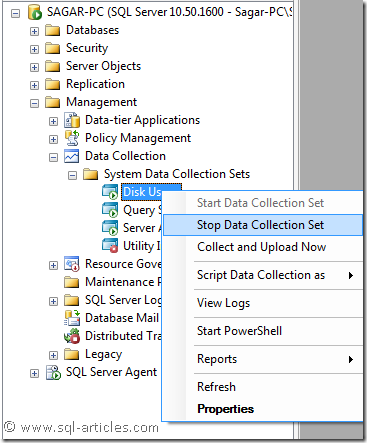
You can start or stop any of the four or all collection step(s) any time. To start or stop a collection set follow the steps below
-
Connect to SQL Server in SSMS
-
Expand Management folder and then expand Data Collection and then System Data collection sets
-
You can find Disk Usage, Query Statistics, Server Activities and Utility Information.
-
Just right click on the required set and then click on Start Data Collection Set or Stop Data Collection Set
Viewing Data Collection Reports
Once you have configured Data collection, your performance data are loaded into performance data warehouse database. Microsoft has provided you report rdl files in SSMS which will enable to view and analyze the reports in GUI format. It will very easy to use and provide statistical information in graph format so that you can analyze the server status within no time. To view the reports follow the steps below
-
Connect to SQL Server in SSMS
-
Expand Management folder and then right click on Data Collection , then click on Reports and then Management Data Warehouse and then click on the respective collection set.
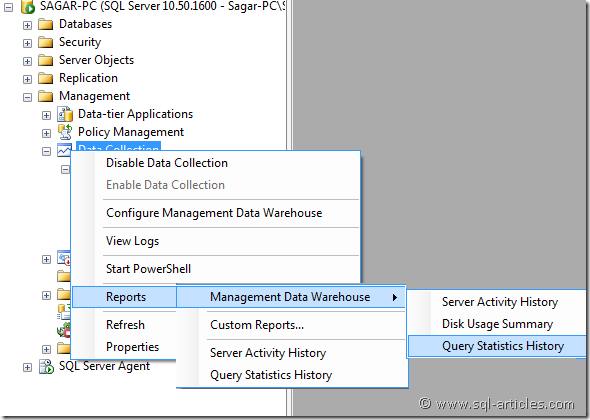
-
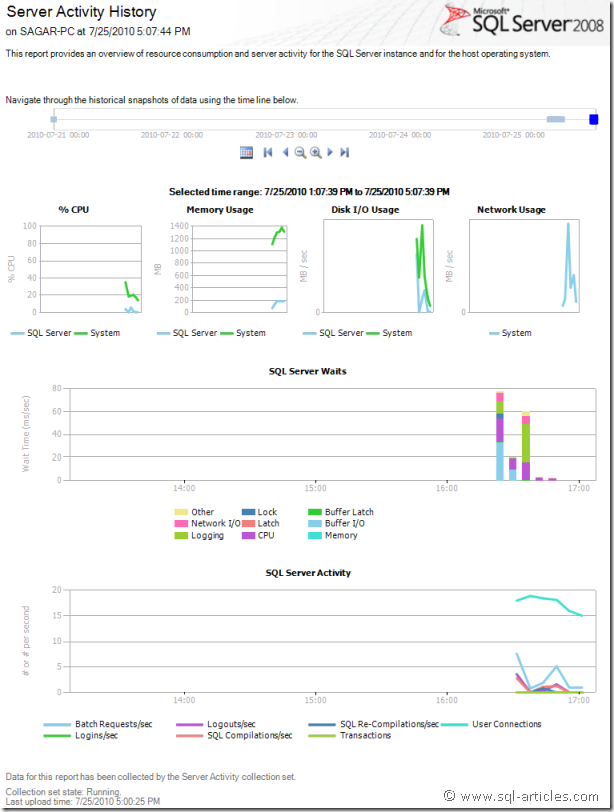
To shown an example Im getting you Server Activity History, some sample images shown below
Views Related to Data Collector
This is the last topic we are going to see in this article. In this section we are going to see the list of views related to data collector and its use wirth respective to data collector.
|
View Name |
Description |
|
Returns information about an item in a collection set |
|
|
Provides information about a collection set, including schedule, collection mode, and its state |
|
|
Provides information about a collector type for a collection item |
|
|
Returns properties that apply to the entire data collector, as opposed to a collection set instance. Each row in this view describes a specific data collector property, such as the name of the management data warehouse, and the instance name where the management data warehouse is located |
|
|
Provides information from the execution log for a collection set or package |
|
|
Provides information about a collection set or package when the execution log is full |
|
|
Provides information about task execution for a collection set or package |
Leave a Reply